Basic Plot
% The basic plot command is plot(x,y). Try the following:
>> x = [0:.1;20];

    >> plot(x,sin(x))
Styling and Decorating Plots
% MATLAB use properties to style and decorate plots. Two of the most useful properties are Color and LineWidth. Here are some examples you can try.
>> x = [0:.1:6*pi];

    >> plot(x,sin(x), 'Color', 'red', 'LineWidth', 3)

    >> plot(x,cos(x), 'Color', 'blue', 'LineWidth', 3)
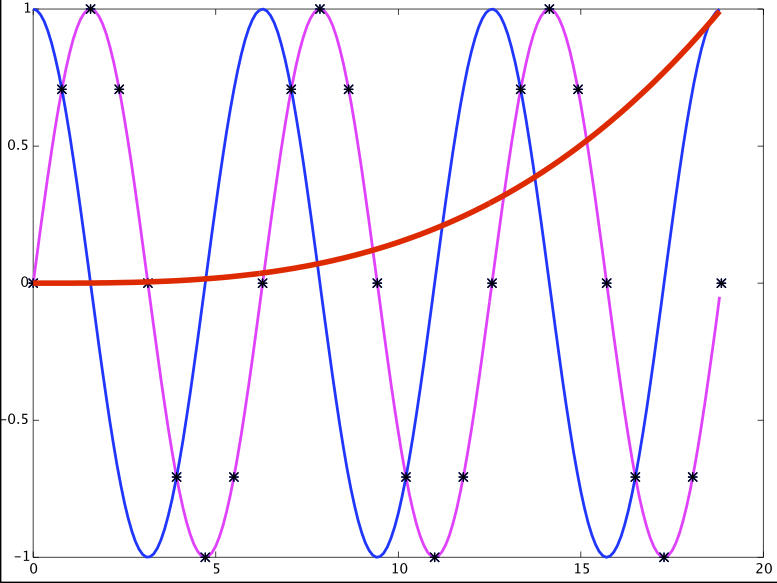
% Often we want to include more than one plot on the same axes. This is set up using the command hold on. 'Hold on' holds the plots on the graph when the next one is drawn. 'Hold off' turns this off and the next plot command will erase all the graphs before drawing the next one. Run these commands one at a time:
 >> x = [0:.1:6*pi];

    >> plot(x,sin(x), 'Color', 'red', 'LineWidth', 3)

    >> hold on

    >> plot(x,cos(x), 'Color', 'blue', 'LineWidth', 3)

    >> plot(x,(x/20).^2, 'Color', 'magenta', 'LineWidth', 3)

    >> hold off
% With hold now set to off the next plot will erase all the previous ones before drawing.
>> plot(x,exp(-(x/20).^2), 'Color', 'black', 'LineWidth', 3)
% Colors can also be specified as an array of 3 numbers between 0 and 1. The triple is a red, green, blue triple. For example
>> hold off
% Blue
>> plot(x,sin(x), 'Color', [0.0, 0.0, 1.0], 'LineWidth', 3)

    >> hold on
% Orange
>> plot(x,cos(x), 'Color', [1.0, 0.625, 0.0], 'LineWidth', 3)

    >> hold off
Three-dimensional plots in MATLAB
% To plot z = f(x,y) you must specify the grid (xi, yj) of lattice points to evalutate the function over. We do this by giving the x vector and y vector and using the MATLAB command meshgrid.
% Here is an example.
% First make vectors with spacing 0.1, over the interval [-2.2] fpr both axes.
>> x = [-2: 0.1: 2];

    >> y = [-2: 0.1: 2];
% Then use meshgrid to make a grid of points (xi, yj).
>> [x, y] = meshgrid(x, y);
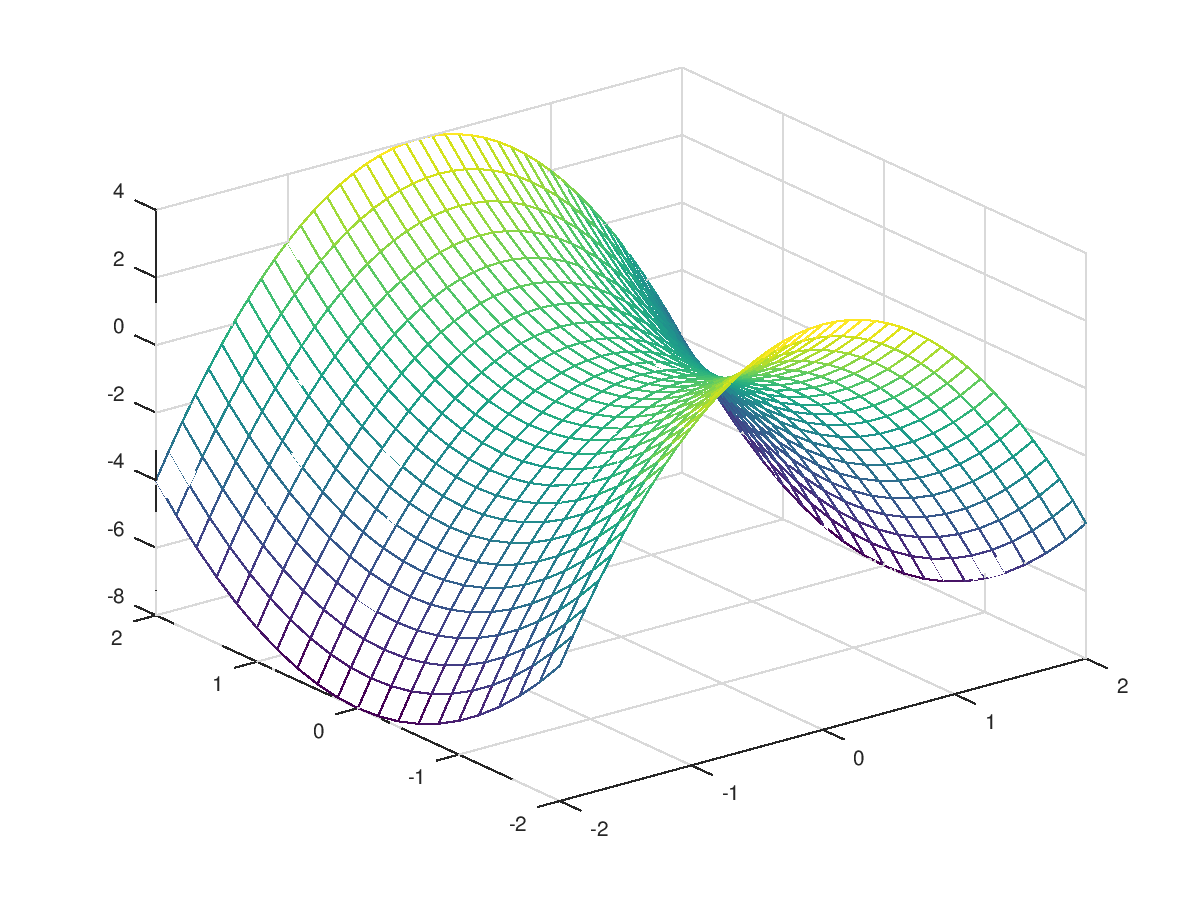
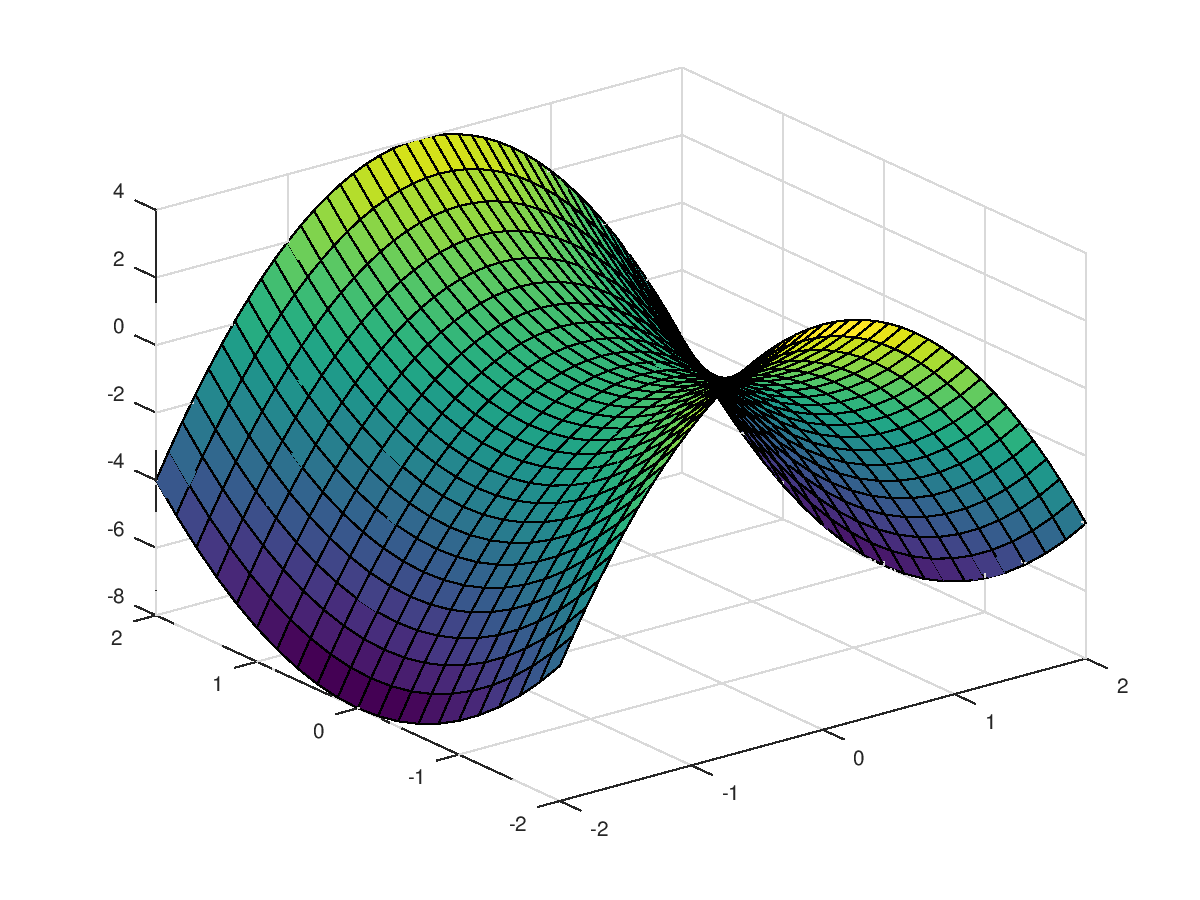
 % Next we plot the function f(x,y) = y2 - 2x2 over the rectangle [-2,2] x [-2,2].

(Note the dots for array operations)
>>z = y.^2 - 2*x.^2;
% We can plot a mesh of lines.
>> mesh(x,y,z)
% We can plot a filled in surface.
>> surf(x,y,z)
% In most installations you can manipulate the plot with the mouse. This can also be done with MATLAB commands.
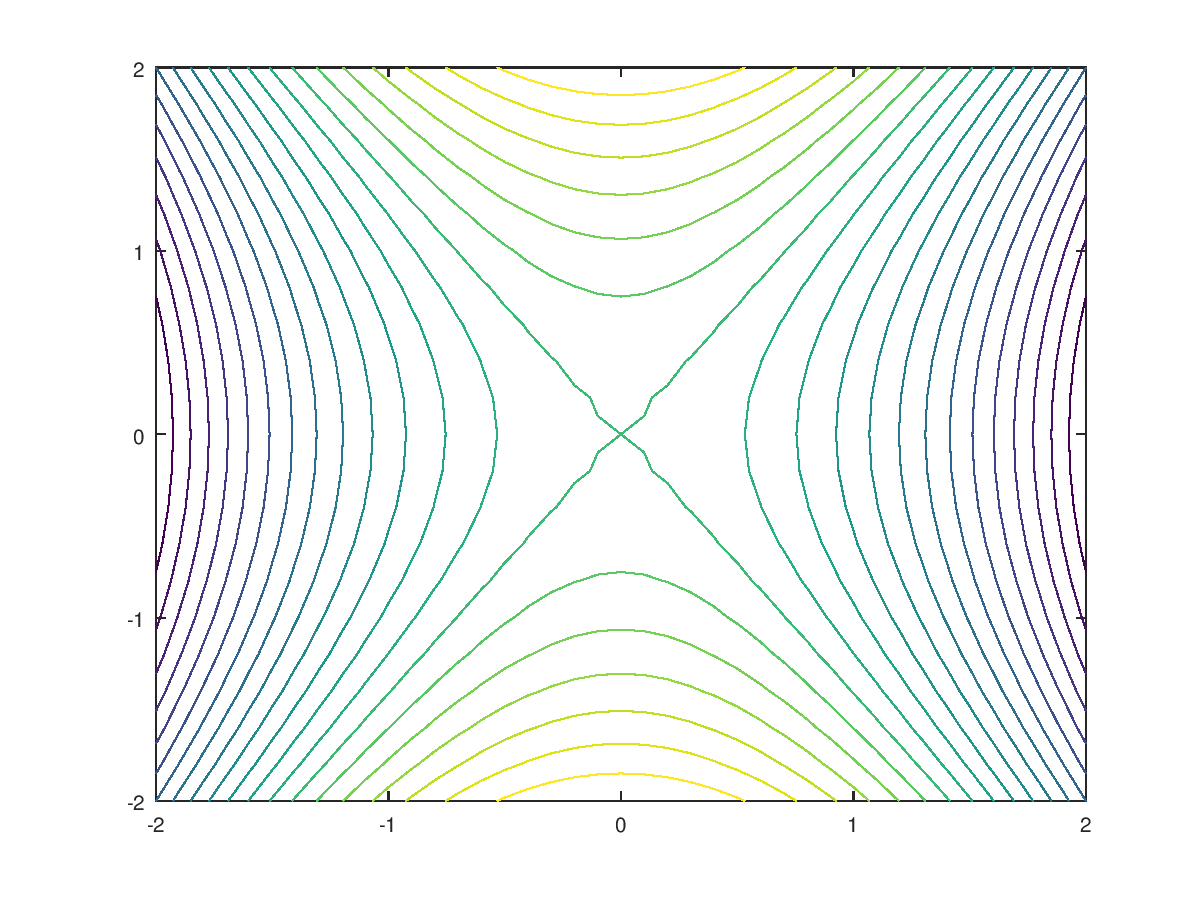
% A 2D plot with 20 level curves.
>> contour(x,y,z,20)
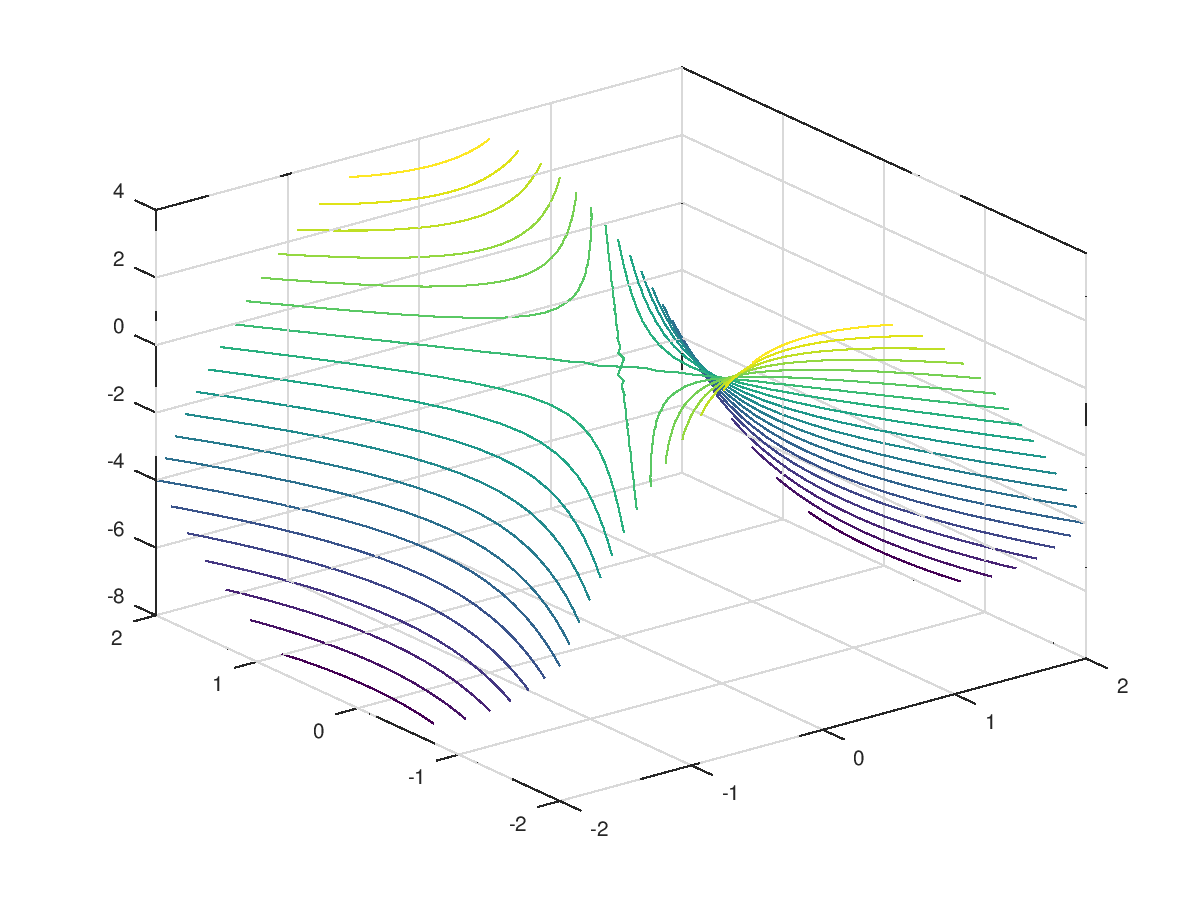
% Or a 3D plot with 20 contour curves.
>> contour3(x,y,z,20)
Final Comments
This is just the tip of the plotting iceberg. MATLAB allows for fine-grained control over most aspects of a plot, including axis labels, text, font size and style, axis ...
