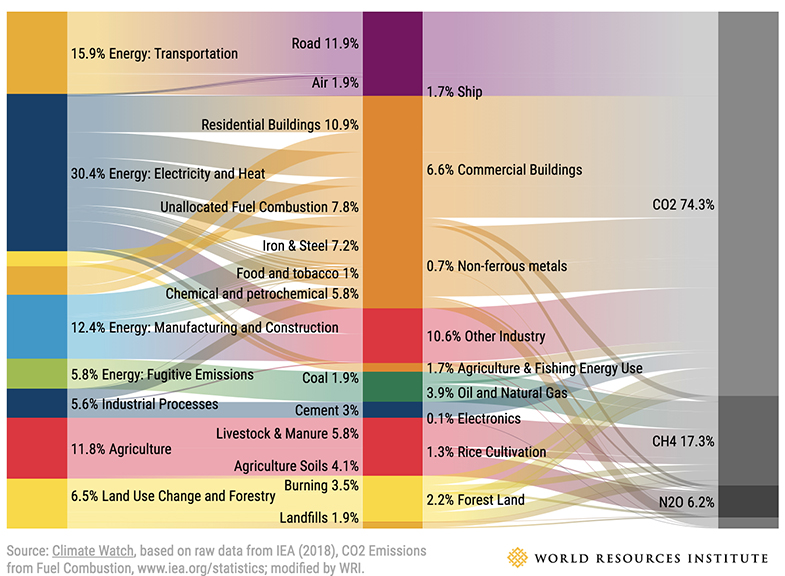
Figure S11.1, from the World Resources Institute (WRI) compares greenhouse gas emissions from agriculture to other major sources in 2016. The primary gases considered are carbon dioxide (CO2), methane (CH4), and nitrous oxide (N2O). The units are the number of gigatons (GtCO2e) of carbon dioxide that give the same radiative forcing as the indicated gas. Most of the direct agricultural emissions are methane and nitrous oxide from manure, soil denitrification, and rice cultivation. A relatively small fraction takes the form of carbon dioxide emissions from agricultural fossil fuel use (included under “Other Fuel Combustion”).
Overall, direct agricultural operations contribute about 13.5% of total global radiative forcing. It should be noted, however, that another 8–10% of agriculturally-related radiative forcing is contributed by the ‘burning’ and ‘cropland’ categories listed under ‘land use change and forestry’ and by industrial operations that support agriculture, most notably fertilizer production. Additional radiative forcing not explicitly noted on the chart is associated with transportation and processing of food after harvest. Although agriculture is an important contributor to radiative forcing, totaling over 20% when all direct and indirect sources are included, it is difficult to see how its emissions could be decreased significantly, especially if meat and rice remain important parts of the global diet.
All calculations in the chart are based on CO2 equivalents, using 100-year global warming potentials from the IPCC (1996), based on total global emissions of 49.4 GtCO2 equivalent.

Figure S11.1 Global greenhouse emission contributions in 2016, by economic sector (World Resources Institute, Accessed August, 2020).
© World Resources Institute. All rights reserved. This content is excluded from our Creative Commons license.
For more information, see https://ocw.mit.edu/help/faq-fair-use/.
