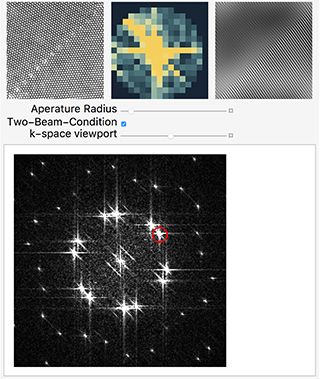
Interactive simulation of selected-area diffraction. The information from one spot (top row, middle) of the diffraction image (bottom) of a twin boundary (top left) is used to selectively reconstruct (top right) an image that contains that spot’s periodicity. (Image by Prof. W. Craig Carter.)
Resource Description
Resource Features
Course Description
This resource is a collection of student tutorial videos that explore various materials science and engineering topics using visualizations in the Wolfram Mathematica programming system.


