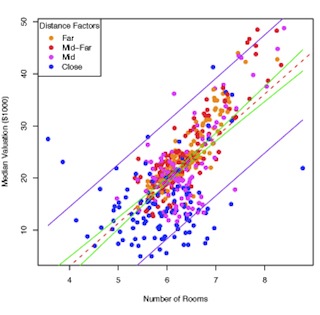
Scatterplot of Boston home data, showing the relationship between home values and the number of rooms in the home. (Image by Ezra Haber Glenn.)
Instructor(s)
Ezra Haber Glenn
MIT Course Number
11.220
As Taught In
Spring 2009
Level
Graduate
Course Description
Course Features
Course Description
This course develops logical, empirically based arguments using statistical techniques and analytic methods. Elementary statistics, probability, and other types of quantitative reasoning useful for description, estimation, comparison, and explanation are covered. Emphasis is on the use and limitations of analytical techniques in planning practice.
Other Versions
Other OCW Versions
Archived versions: ![]()


