Session Overview
 |
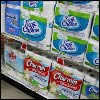
Everyone knows the unpleasant feeling that results from the price of something you've been longing to buy increasing – or the excitement of seeing your favorite snack go on sale! When the price of a good changes, consumers' demand for that good changes. We can understand these changes by graphing supply and demand curves and analyzing their properties. Toilet paper is an example of an elastic good. Image courtesy of Nic Stage on Flickr. |
Keywords: Elasticity; revenue; empirical economics; demand elasticity; supply elasticity.
Session Activities
Readings
Before watching the lecture video, read the course textbook for an introduction to the material covered in this session:
- [R&T] Chapter 5, "Elasticity: A Measure of Response."
- [Perloff] Chapter 3, "Applying the Supply-and-Demand Model." (optional)
Lecture Videos
-
View Full Video
View by Chapter
- The Elasticity of Supply and Demand (0:15:02)
- Using Empirical Economics to Determine Elasticity (0:10:06)
- Elasticity and Taxation (0:11:09)
- Elasticity and Medical Care (0:11:37)
Resources
Check Yourself
Concept Quiz
This concept quiz covers key vocabulary terms and also tests your intuitive understanding of the material covered in this session. Complete this quiz before moving on to the next session to make sure you understand the concepts required to solve the mathematical and graphical problems that are the basis of this course.
Further Study
These optional resources are provided for students that wish to explore this topic more fully.
Textbook Study Materials
See the [Perloff] chapter for the topics covered, as well as quizzes, applications, and other related resources.
